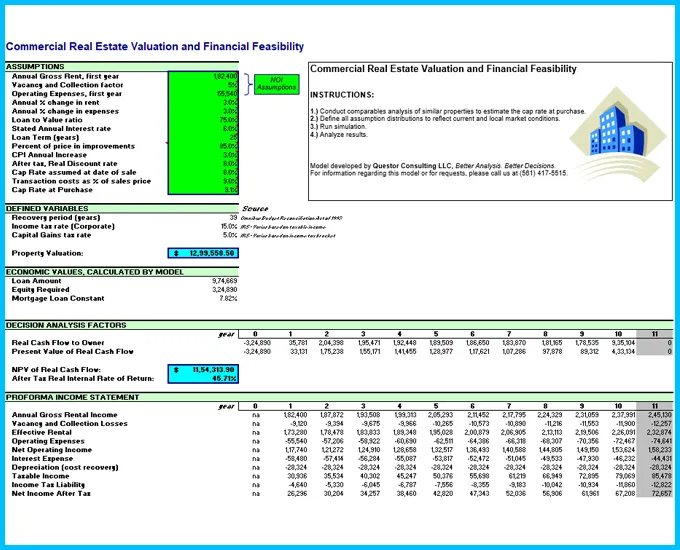
The purpose of this spreadsheet model is twofold: 1) to estimate the valuation of commercial property and 2) to determine the financial feasibility of an investment in the subject property for a 10 year holding period. The uncertainty in this model lies in the many economic factors to be input as assumptions by the user. The most important assumptions in this analysis are the Net Operating Income assumptions (Annual Gross Rent, Vacancy and Collection Loss Factor, and Operating Expenses) and the Cap Rate at Purchase. Special attention should be given to these assumptions.
Commercial property valuation is estimated using 2 factors: 1) The current Net Operating Income (NOI - Gross Rent Roll minus vacancy and collection losses and operating expenses) and 2) The Cap Rate. The Cap Rate for the property is best estimated by analyzing comparable. The Market Value and Cap Rate can be calculated using the following formulas:
Cap Rate = NOI / Sale Price
Market Value = (NOI / (Cap Rate (%) * 100)) * 100
The financial feasibility of the investment is expressed in two factors: 1) The Net Present Value of Real Cash Flow and 2) the After Tax Real Rate of Return. The model calculates these values automatically by creating Pro Forma statements based on the assumptions input by the user.
Crystal Ball enhances your Excel model by letting you create probability distributions that describe the uncertainty surrounding specific input variables. This model includes multiple probability distributions, which all vary based on market conditions. These distributions are referred to in Crystal Ball as "assumptions." Each assumption cell is colored green and is marked by an Excel note (mouse over the cell to view the note). To view the details of an assumption, highlight the cell and either select Define Assumption from the Define menu or click on the Define Assumption button on the Crystal Ball toolbar.
This model also includes several Crystal Ball forecasts: Property Valuation, NPV of Real Cash Flow, and After Tax IRR, all shown in light blue. Forecasts are equations, or outputs, that you want to analyze after a simulation. During a simulation, Crystal Ball saves the values in the forecast cells and displays them in a Forecast Chart, which is a histogram of the simulated values. To view the forecast with Crystal Ball, highlight the cell and either select Define Forecast from the Define menu or click on the Define Forecast button on the toolbar.
When you run a simulation, Crystal Ball generates a random number for each assumption (based on how the assumption has been defined) and places that new value in the cell. Excel then recalculates the model. You can test this by selecting Single Step from the Run menu or clicking on the Single Step button on the toolbar.
After you run a simulation, you will see the Property Valuation, NPV of Real Cash Flow, and After Tax IRR forecast charts. You can view the statistics or percentile values of the run, or you can enter values into the input fields on the frequency chart view. What is the chance that you will breakeven, i.e. have a NPV of zero? What is the chance you will lose money? (Hint: enter a number into the lower left field and use the Enter button on your keyboard to accept the value.)
To view which of the two assumptions had the greatest impact on the forecast, use the Sensitivity Chart. Which variable causes the most variation in the target forecast? Can you somehow reduce this source of uncertainty and improve your overall forecast? Change the assumption parameters or the assumption types, run a new simulation (hint: don't forget to hit the reset button before beginning a new simulation!), and compare the results. You can also generate a report by selecting Create Report from the Run menu or clicking on the Create Report button on the toolbar.
 Test Template John Doe 888
Leadership Slide Template for PowerPoint
Test Template John Doe 888
Leadership Slide Template for PowerPoint
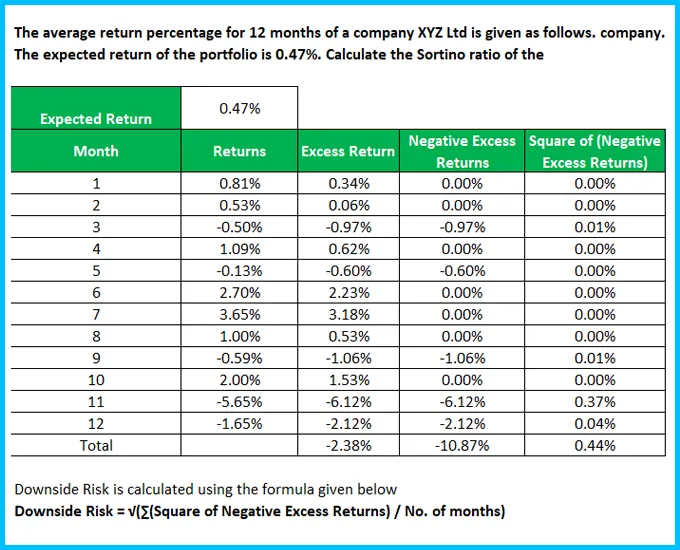
 Sortino Ratio Template
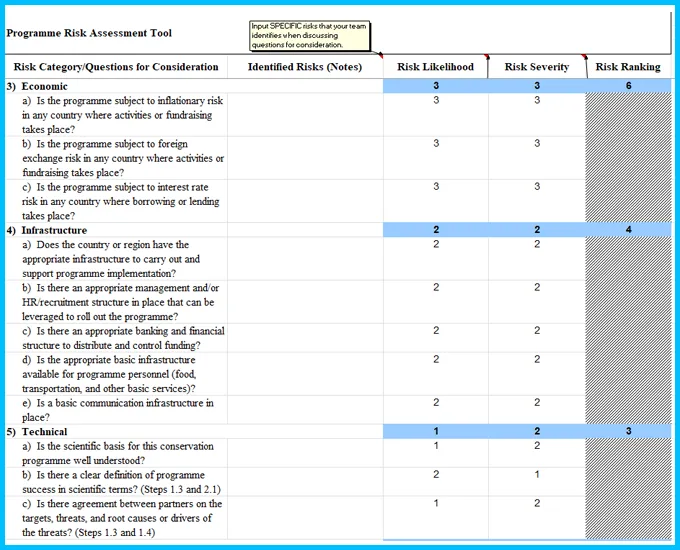
Risk Ranking and Mitigation
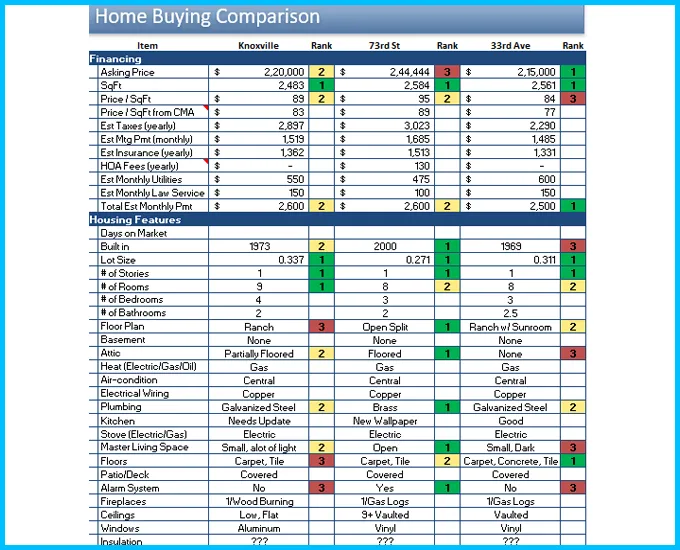
Home Buying Comparison Template
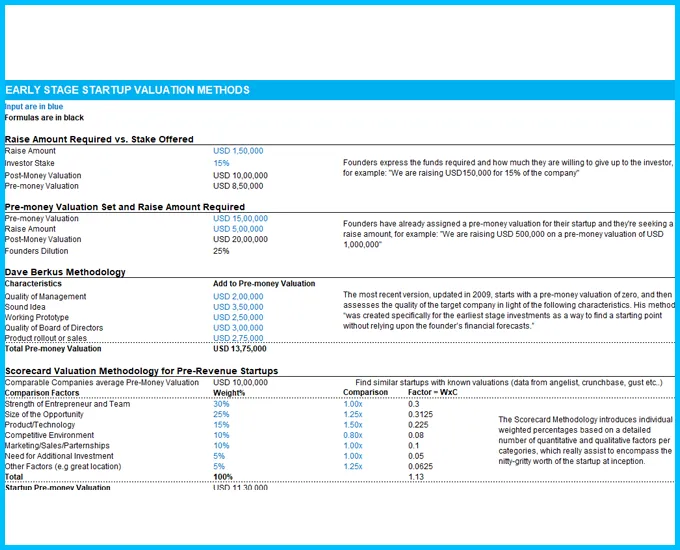
Early Stage Startup Valuation Methods
Commercial Real Estate Valuation Model
Checkbook Register Template
Sortino Ratio Template
Risk Ranking and Mitigation
Home Buying Comparison Template
Early Stage Startup Valuation Methods
Commercial Real Estate Valuation Model
Checkbook Register Template
 Project Management Agreement Template
Wedding photography contract Template
Non Disclosure Agreement Template
Event Budget Template
Cold Email Sales Weekly Activity Spreadsheet
Branding and Creative Budget Template
Blog Editorial Calendar - Google Calendar
Project Management Agreement Template
Wedding photography contract Template
Non Disclosure Agreement Template
Event Budget Template
Cold Email Sales Weekly Activity Spreadsheet
Branding and Creative Budget Template
Blog Editorial Calendar - Google Calendar

Find a pre-made digital template of any type and topic or ask a professional to create a custom one for you