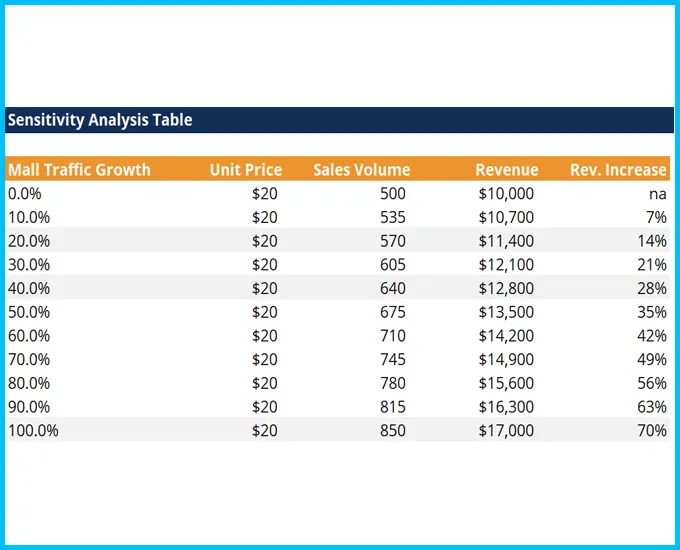
This sensitivity analysis table template helps you predict sales revenue based on changes in input variables including traffic growth, unit price, and sales volume.
Sensitivity Analysis is a tool used in financial modeling to analyze how the different values of a set of independent variables affect a specific dependent variable under certain specific conditions. In general, Sensitivity Analysis is used in a wide range of fields – from biology and geography to economics and engineering.
A Financial Sensitivity Analysis, also known as a What-If analysis or a What-If simulation exercise, is most commonly used by financial analysts to predict the outcome of a specific action when performed under certain conditions. It is done within defined boundaries that are determined by the set of independent (input) variables.
The analysis is performed in Excel under the Data section of the ribbon and the “What-if Analysis” button, which contains Goal Seek and Data Table.
 Test Template John Doe 888
Leadership Slide Template for PowerPoint
Test Template John Doe 888
Leadership Slide Template for PowerPoint
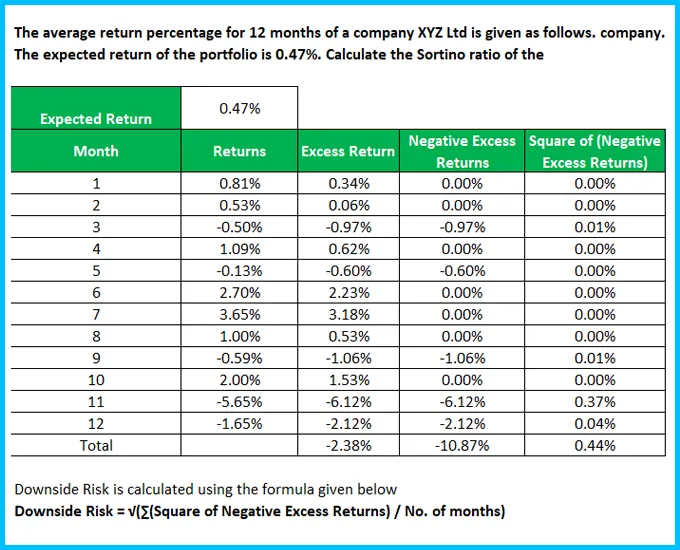
 Sortino Ratio Template
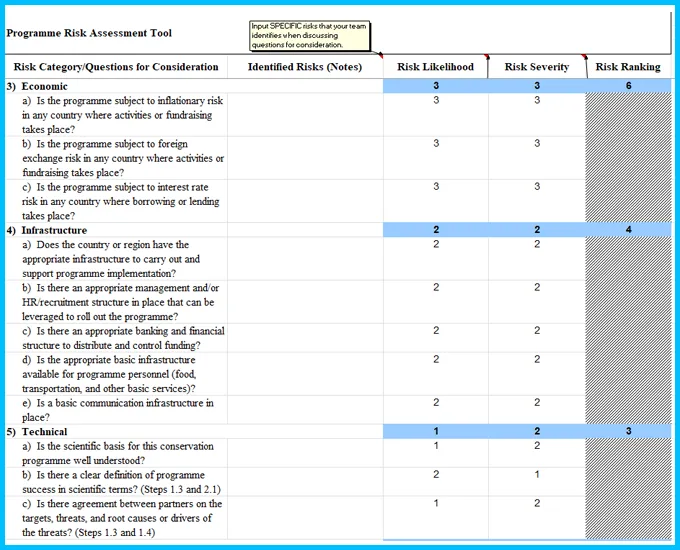
Risk Ranking and Mitigation
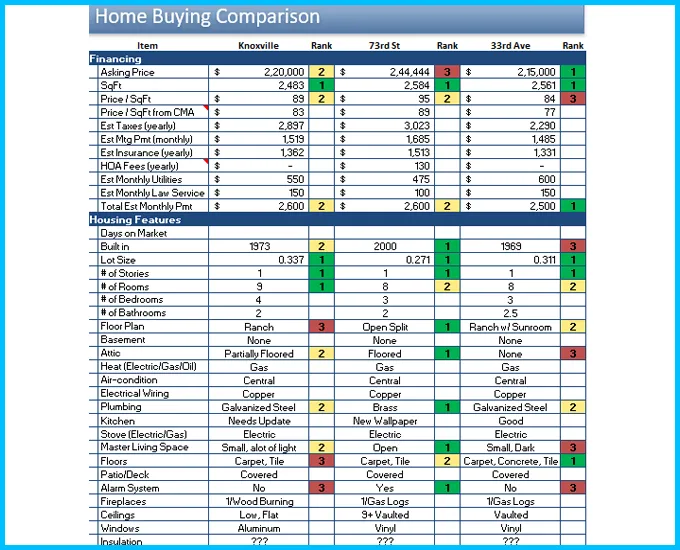
Home Buying Comparison Template
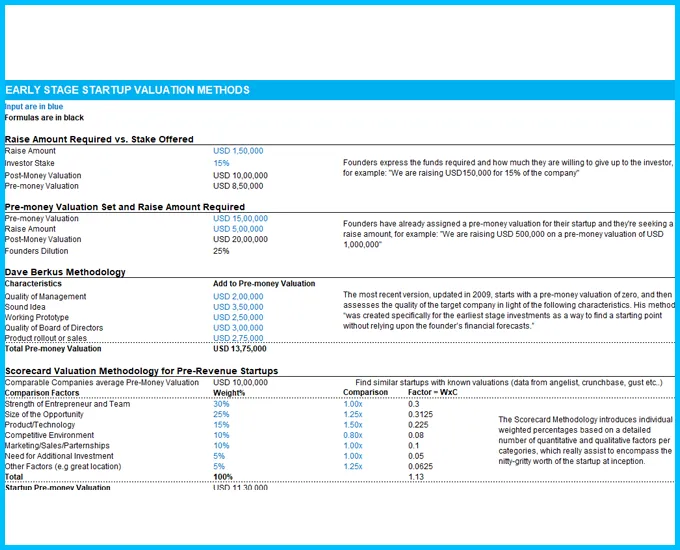
Early Stage Startup Valuation Methods
Commercial Real Estate Valuation Model
Checkbook Register Template
Sortino Ratio Template
Risk Ranking and Mitigation
Home Buying Comparison Template
Early Stage Startup Valuation Methods
Commercial Real Estate Valuation Model
Checkbook Register Template
 Project Management Agreement Template
Wedding photography contract Template
Non Disclosure Agreement Template
Event Budget Template
Cold Email Sales Weekly Activity Spreadsheet
Branding and Creative Budget Template
Blog Editorial Calendar - Google Calendar
Project Management Agreement Template
Wedding photography contract Template
Non Disclosure Agreement Template
Event Budget Template
Cold Email Sales Weekly Activity Spreadsheet
Branding and Creative Budget Template
Blog Editorial Calendar - Google Calendar

Find a pre-made digital template of any type and topic or ask a professional to create a custom one for you