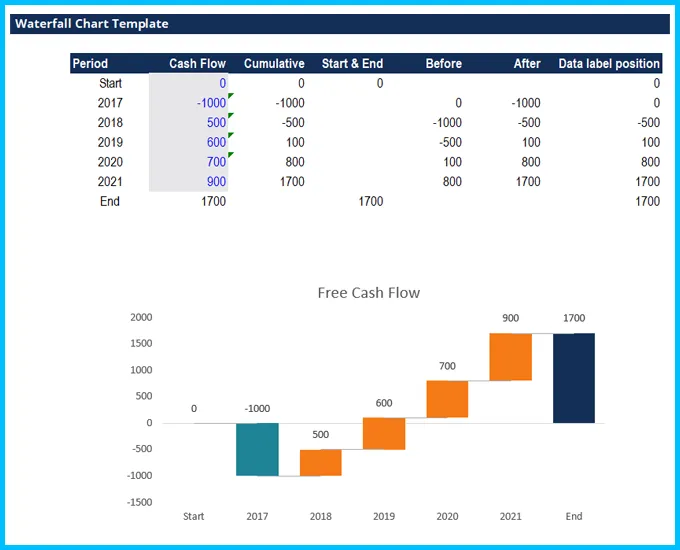
This waterfall chart template guides you step-by-step to construct a waterfall chart using raw data.
A waterfall chart is a great way to visually show the effect of positive and negative cash flows on a cumulative basis. In Excel 2016, there is a built-in waterfall chart option so it is a very simple and quick process. If you’re working in Excel 2013 or earlier version, you will have to build your own waterfall chart using the stacked column chart feature.
In order to build your own waterfall chart, you first have to organize your data into a table.
Use the Up/Down Bars feature in charts to create the foundation of the waterfall chart.
Use the Column Data Label Position to define the position of the data labels.
Use the Error Bars feature in charts to show changes between each Up/Down bar.
Credits to : Corporate Finance Institute
 Test Template John Doe 888
Leadership Slide Template for PowerPoint
Test Template John Doe 888
Leadership Slide Template for PowerPoint
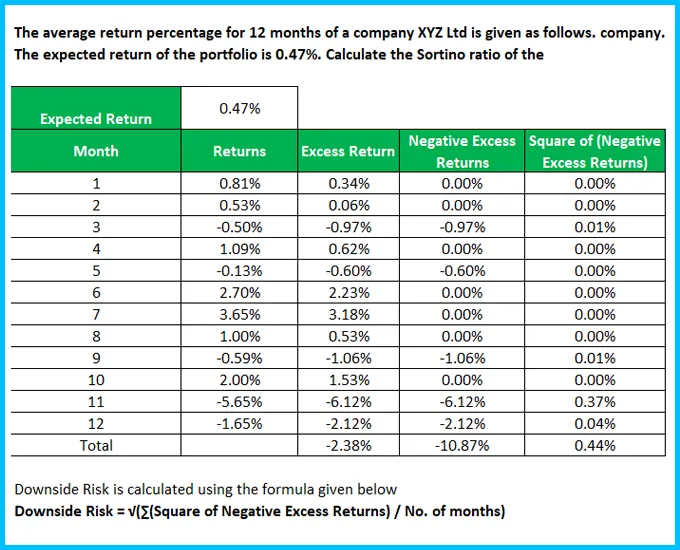
 Sortino Ratio Template
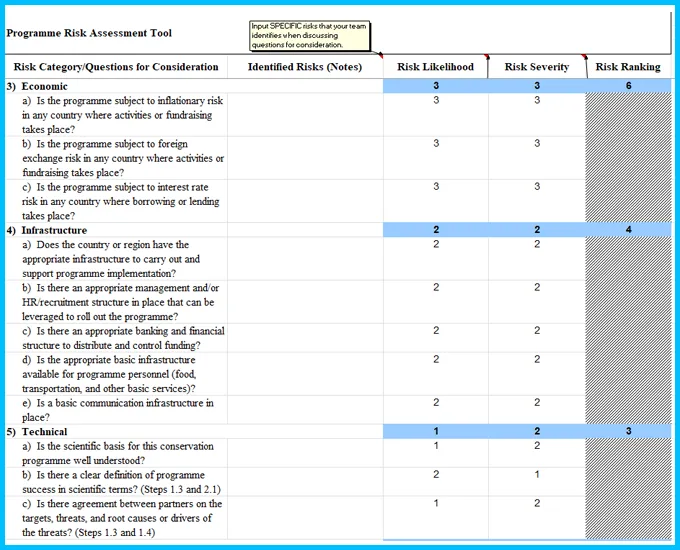
Risk Ranking and Mitigation
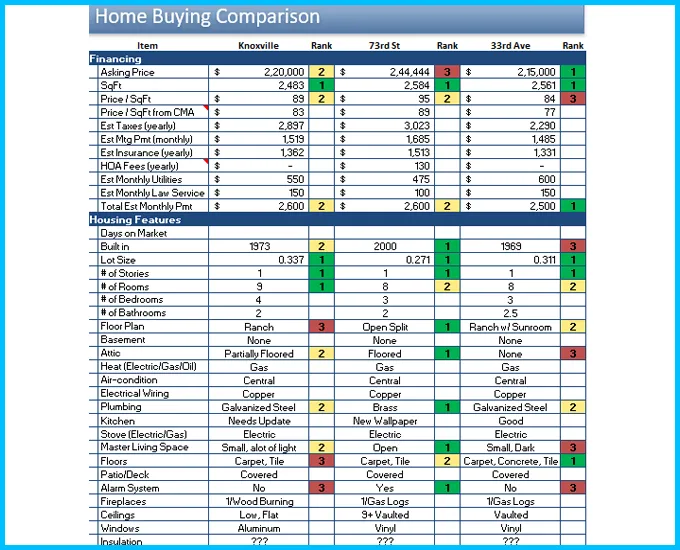
Home Buying Comparison Template
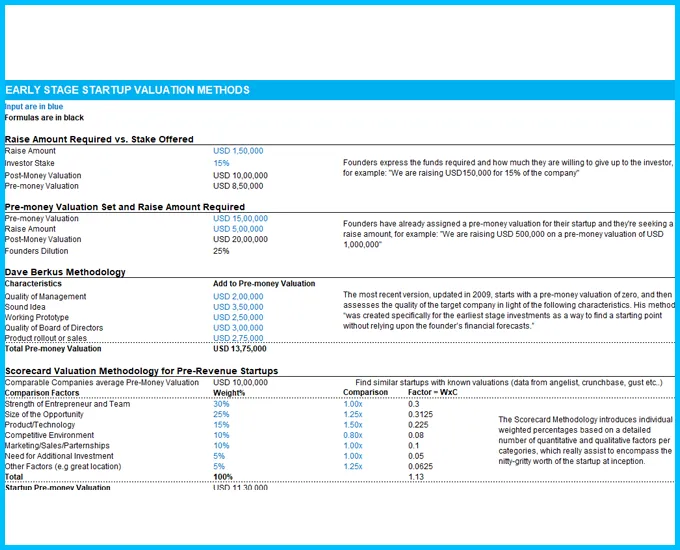
Early Stage Startup Valuation Methods
Commercial Real Estate Valuation Model
Checkbook Register Template
Sortino Ratio Template
Risk Ranking and Mitigation
Home Buying Comparison Template
Early Stage Startup Valuation Methods
Commercial Real Estate Valuation Model
Checkbook Register Template
 Project Management Agreement Template
Wedding photography contract Template
Non Disclosure Agreement Template
Event Budget Template
Cold Email Sales Weekly Activity Spreadsheet
Branding and Creative Budget Template
Blog Editorial Calendar - Google Calendar
Project Management Agreement Template
Wedding photography contract Template
Non Disclosure Agreement Template
Event Budget Template
Cold Email Sales Weekly Activity Spreadsheet
Branding and Creative Budget Template
Blog Editorial Calendar - Google Calendar

Find a pre-made digital template of any type and topic or ask a professional to create a custom one for you